Woods Hole Assessment Model
Growth estimation
 Mean length-at-age variability.
⚠️ This tutorial is under development and some features could change in future versions
Here, I present the extended features that my colleagues and I have incorporated into the Woods Hole Assessment Model (WHAM). These new feautres can be found in Correa et al. (2023). The base features of this model has been developed by Brian Stock and Tim Miller, and are reported in Stock and Miller (2021) and references therein. Also, several vignettes can be found on the WHAM website. This tutorial has been built assuming that the reader is familiar with WHAM.
The features described here are available on the growth branch forked from the devel branch of the WHAM GitHub repository and can be installed running:
remotes::install_github(repo = 'GiancarloMCorrea/wham', ref='growth', INSTALL_opts = c("--no-docs", "--no-multiarch", "--no-demo"))
Then:
library(wham)
✔️ This new WHAM version produces the same results as the base WHAM (devel branch) version (when using the same input data)
Data
New data inputs have been added. There are two main ways how WHAM can read the input data: reading an ASAP3 data file or creating an R object (list). Here, we will explore the latter option:
wham_data = list()
wham_data will contain the data used by WHAM. For example, the age
bins or years:
wham_data$ages = 1:21 # age bins
wham_data$years = 1970:2020 # years
To explore all the basic inputs, see the WHAM website.
Some new inputs available are:
wham_data$lengths: fish length bins (cm). Length bin width should be uniform.wham_data$catch_pal: Length compositions for fisheries. Array (number of fisheries × number of years × number of length bins).wham_data$catch_NeffL: Input sample size for length compositions (fisheries). Matrix (number of years × number of fisheries).wham_data$use_catch_pal: Use (1) or not use (0) length compositions (fisheries). Matrix (number of years × number of fisheries).wham_data$catch_caal: Conditional length-at-age (CAAL) for fisheries. Array (number of fisheries × number of years × number of length bins × number of ages).wham_data$catch_caal_Neff: Input sample size for CAAL (fisheries). Array (number of years × number of fisheries × number of length bins).wham_data$use_catch_caal: Use (1) or not use (0) CAAL (fisheries). Array (number of years × number of fisheries × number of length bins).wham_data$index_pal: Length compositions for indices. Array (number of indices × number of years × number of length bins).wham_data$index_NeffL: Input sample size for length compositions (indices). Matrix (number of years × number of indices).wham_data$use_index_pal: Use (1) or not use (0) length compositions (indices). Matrix (number of years × number of indices).wham_data$index_caal: Conditional age-at-length (CAAL) for indices. Array (number of indices × number of years × number of length bins × number of ages).wham_data$index_caal_Neff: Input sample size for CAAL (indices). Array (number of years × number of indices × number of length bins).wham_data$use_index_caal: Use (1) or not use (0) CAAL (indices). Array (number of years × number of indices × number of length bins).
Aging error information (fleet-specific) can also be incorporated:
wham_data$index_aging_error: Aging error for indices. Array (number of indices × number of ages × number of ages).wham_data$use_index_aging_error: Use (1) or not use (0) aging error matrix (indices). Vector.wham_data$catch_aging_error: Aging error for fisheries. Array (number of fisheries × number of ages × number of ages).wham_data$use_catch_aging_error: Use (1) or not use (0) aging error matrix (fisheries). Vector.
All of these data inputs are not mandatory (i.e. if length compositions
for indices are not available, wham_data$index_pal,
wham_data$index_NeffL, and wham_data$use_index_pal do not need to be
created).
There are another important data inputs that will be explained below.
Parameters
All parameters are specified using the prepare_wham_input function. I
invite the readers to take a look at the help of that function
(?prepare_wham_input) to find more details about the new features
implemented here.
The length composition model is specified in the prepare_wham_input
function:
prepare_wham_input(...,
                   len_comp = "multinomial",
                   ...)
For CAAL data, the model should be specified in the age_comp argument.
Selectivity
prepare_wham_input(...,
                   selectivity = list(model, re, initial_pars, fix_pars, n_selblocks),
                   ...)
The base WHAM version has four selectivity-at-age models (model) (
see
here
): age-specific, logistic, double-logistic, decreasing-logistic.
For this new WHAM version, the selectivity can be at age or at length, and the following options are available:
age-specific: selectivity by age (number of parameters is the number of ages)logistic: increasing logistic at age (2 parameters)double-logistic: double logistic at age (4 parameters)decreasing-logistic: decreasing logistic at age (2 parameters)double-normal: double normal at age (6 parameters) (see Privitera-Johnson, Methot, and Punt (2022) )len-logistic: increasing logistic at length (2 parameters)len-decreasing-logistic: decreasing logistic at length (2 parameters)len-double-normal: double normal at length (6 parameters)
Somatic growth

When we talk about somatic growth, we could refer to changes in length-at-age or weight-at-age, therefore we will divide this section into two parts.
Mean length-at-age (LAA)
There are two main ways to model changes in LAA: parametric and non-parametric approach. The parametric approach may be the von Bertalanffy growth function or the Richards equation.
von Bertalanffy growth function
As parametrized by Schnute (1981). There are three main parameters:
- k : growth rate
- Linf : Asymptotic length
- Lã : length at age ã (reference age).
prepare_wham_input(...,
                   growth = list(model = "vB_classic", re, init_vals, est_pars,
                                 SD_vals, SD_est),
                   ...)
The arguments are:
growth$re: random effects (RE) on growth parameters. Five options are available:
growth$re | Random effects | Estimated parameters |
|---|---|---|
none | constant in time | |
iid_y | varies by year (uncorrelated) | σG |
iid_c | varies by cohort (uncorrelated) | σG |
ar1_y | correlated by year (AR1) | σG, ρ |
ar1_c | correlated by cohort (AR1) | σG, ρ |
growth$init_vals: growth parameters initial values.growth$est_pars: Which growth parameter to estimate.
We specify two parameters growth$SD_vals (and their estimation
growth$SD_est) that describe the variability of length-at-age:
- SDã: standard deviation of lengths at age ã. It is a function of mean length-at-age.
- SDA: standard deviation of lengths at age A (age plus group). It is a function of mean length-at-age.
Random effects cannot be predicted on SDã and SDA.
ã is specified in the data input object:
wham_data$age_L1: Default value is 1
Richards growth function
In this option, we have four (4) main parameters:
- k : growth rate
- Linf : Asymptotic length
- Lã : length at age ã (reference age)
- γ : shape parameter
prepare_wham_input(...,
                   growth = list(model = "Richards", re, init_vals, est_pars,
                                 SD_vals, SD_est),
                   ...)
Options for the structure of random effects are the same as in the von Bertalanffy growth equation.
LAA random effects (non-parametric approach)
The number of parameters is equal to the number of ages.
prepare_wham_input(...,
                   LAA = list(LAA_vals, re, est_pars, SD_vals, SD_est),
                   ...)
The arguments are:
LAA$LAA_vals: LAA initial values (length equal to the number of ages).LAA$re: random effects (RE) on LAA (1). Five options are available:
LAA$re | Random effects | Estimated parameters |
|---|---|---|
none | constant in time and ages | |
iid | varies by year and age (uncorrelated) | σL |
iid_a | varies by age (uncorrelated) | σL |
ar1_a | correlated by age (AR1) | σL, ρa |
2dar1 | correlated by age and year (2D AR1) | σL, ρa, ρy |
3dgmrf | 3D GMRF (years, ages, cohorts) | σL, ρa, ρy, ρc |
LAA$est_pars: Which LAA to estimate.
Semi-parametric approach
For this approach, mean length-at-age are calculated using any of the parametric equations (von Bertalanffy or Richards), and then random effects can be predicted on these. Random effect’s structure same as shown in the non-parametric approach.
The following arguments need to be specified:
prepare_wham_input(...,
                   growth = list(model, init_vals, est_pars,
                                 SD_vals, SD_est),
                   LAA = list(re),
                   ...)
Mean weight-at-age (WAA)
In this new version, there are three ways to model changes in WAA:
Empirical weight-at-age
This is the only strategy available in the base WHAM version, the user
should provide the empirical weight-at-age as input data
(wham_data$waa), which will be used to calculate spawning biomass and
reference points. Make sure that:
Length-weight relationship
prepare_wham_input(...,
                   LW = list(re, init_vals, est_pars),
                   ...)
The user could use a length-weight relationship to model changes in WAA based on LAA. The arguments are:
LW$re: random effects (RE) on LW parameters (2). Five options are available:
LW$re | Random effects | Estimated parameters |
|---|---|---|
none | constant in time | |
iid_y | varies by year (uncorrelated) | σW |
iid_c | varies by cohort (uncorrelated) | σW |
ar1_y | correlated by year (AR1) | σW, ρ |
ar1_c | correlated by cohort (AR1) | σW, ρ |
LW$init_vals: LW parameters initial values (2).LW$est_pars: LW parameter to estimate.
Also, the user could use observed mean weight-at-age data as source of information:
wham_data$use_catch_waa: Use (1) or not use (0) waa (fisheries). Matrix (number of years × number of fisheries).wham_data$use_index_waa: Use (1) or not use (0) waa (indices). Matrix (number of years × number of indices).wham_data$waa_cv: Coefficient of variation for observations. Array (dim(wham_data$waa) == dim(wham_data$waa_cv)).
WAA random effects (non-parametric approach)
Like the LAA random effects approach. The number of parameters is equal to the number of ages.
prepare_wham_input(...,
                   WAA = list(WAA_vals, re, est_pars),
                   ...)
The arguments are:
WAA$WAA_vals: WAA initial values (length equal to the number of ages).WAA$re: random effects (RE) on WAA (1). Five options are available:
WAA$re | Random effects | Estimated parameters |
|---|---|---|
none | constant in time and ages | |
iid | varies by year and age (uncorrelated) | σW |
iid_a | varies by age (uncorrelated) | σW |
ar1_a | correlated by age (AR1) | σW, ρa |
2dar1 | correlated by age and year (2D AR1) | σW, ρa, ρy |
3dgmrf | 3D GMRF (years, ages, cohorts) | σW, ρa, ρy, ρc |
WAA$est_pars: WAA to estimate.
Also, the user could use observed mean weight-at-age data as source of information similar to the previous method.
The semi-parametric approach for mean weight-at-age is not yet implemented.
This is a general overview about growth modeling in this new WHAM version:

Environmental covariates
I assume that the user is familiar with the syntax to include environmental covariates in WHAM. In this version, new options are available:
prepare_wham_input(...,
                   ecov = list(...,
                               where = 'growth',
                               where_subindex = 1,
                               ....),
                   ...)
where can be growth (parametric growth equation), LAA
(non-parametric approach), LW, or WAA (non-parametric approach).
where_subindex is the parameter that will be linked to the
environmental covariate, and the subindex number follows the order as
mentioned in the previous section (e.g. where = 'growth' and
where_subindex = 2 will link the environmental covariate to the
asymptotic length).
✔️ Projections and OSA residuals are also available
Analysis of results
The function plot_wham_output produces plots to summary the data
inputs, outputs, parameters, and others. This function was also expanded
in this new WHAM version.
Input data
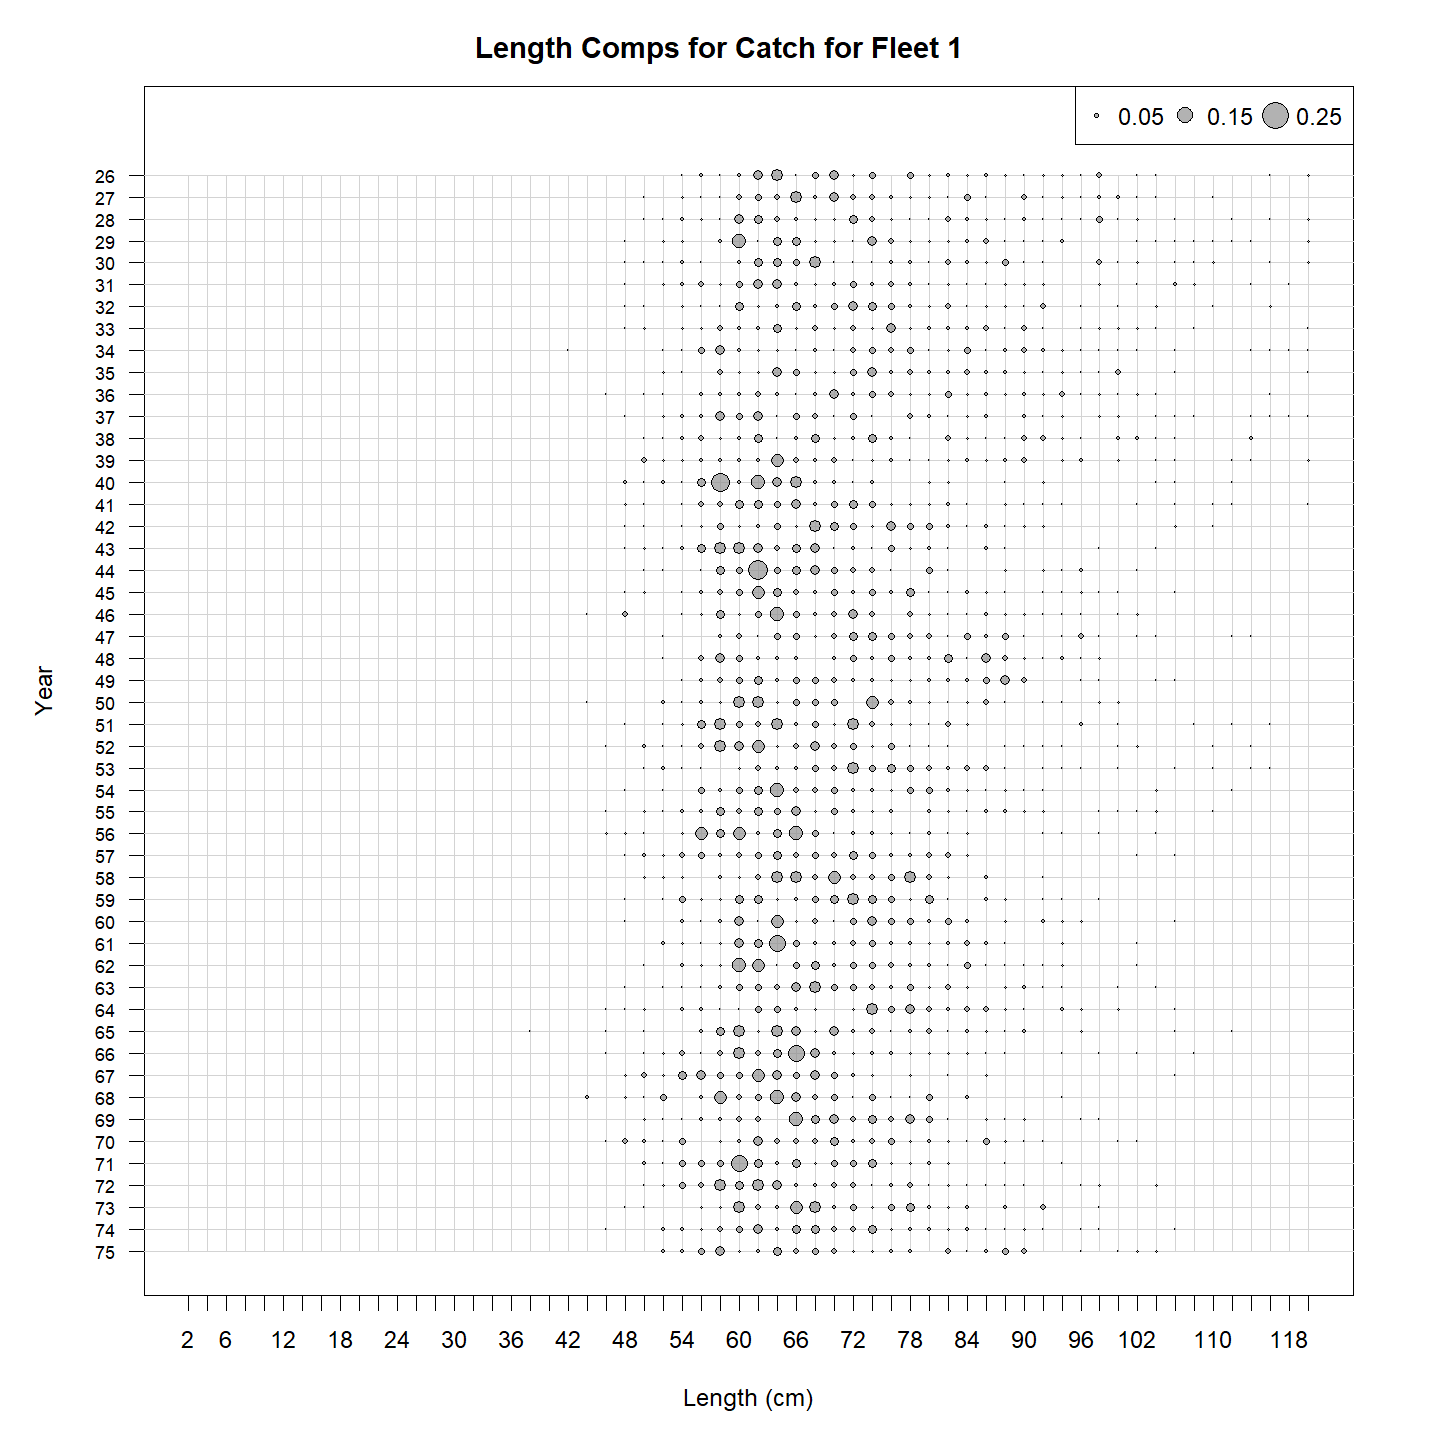
We can get a plot of the observed length compositions:
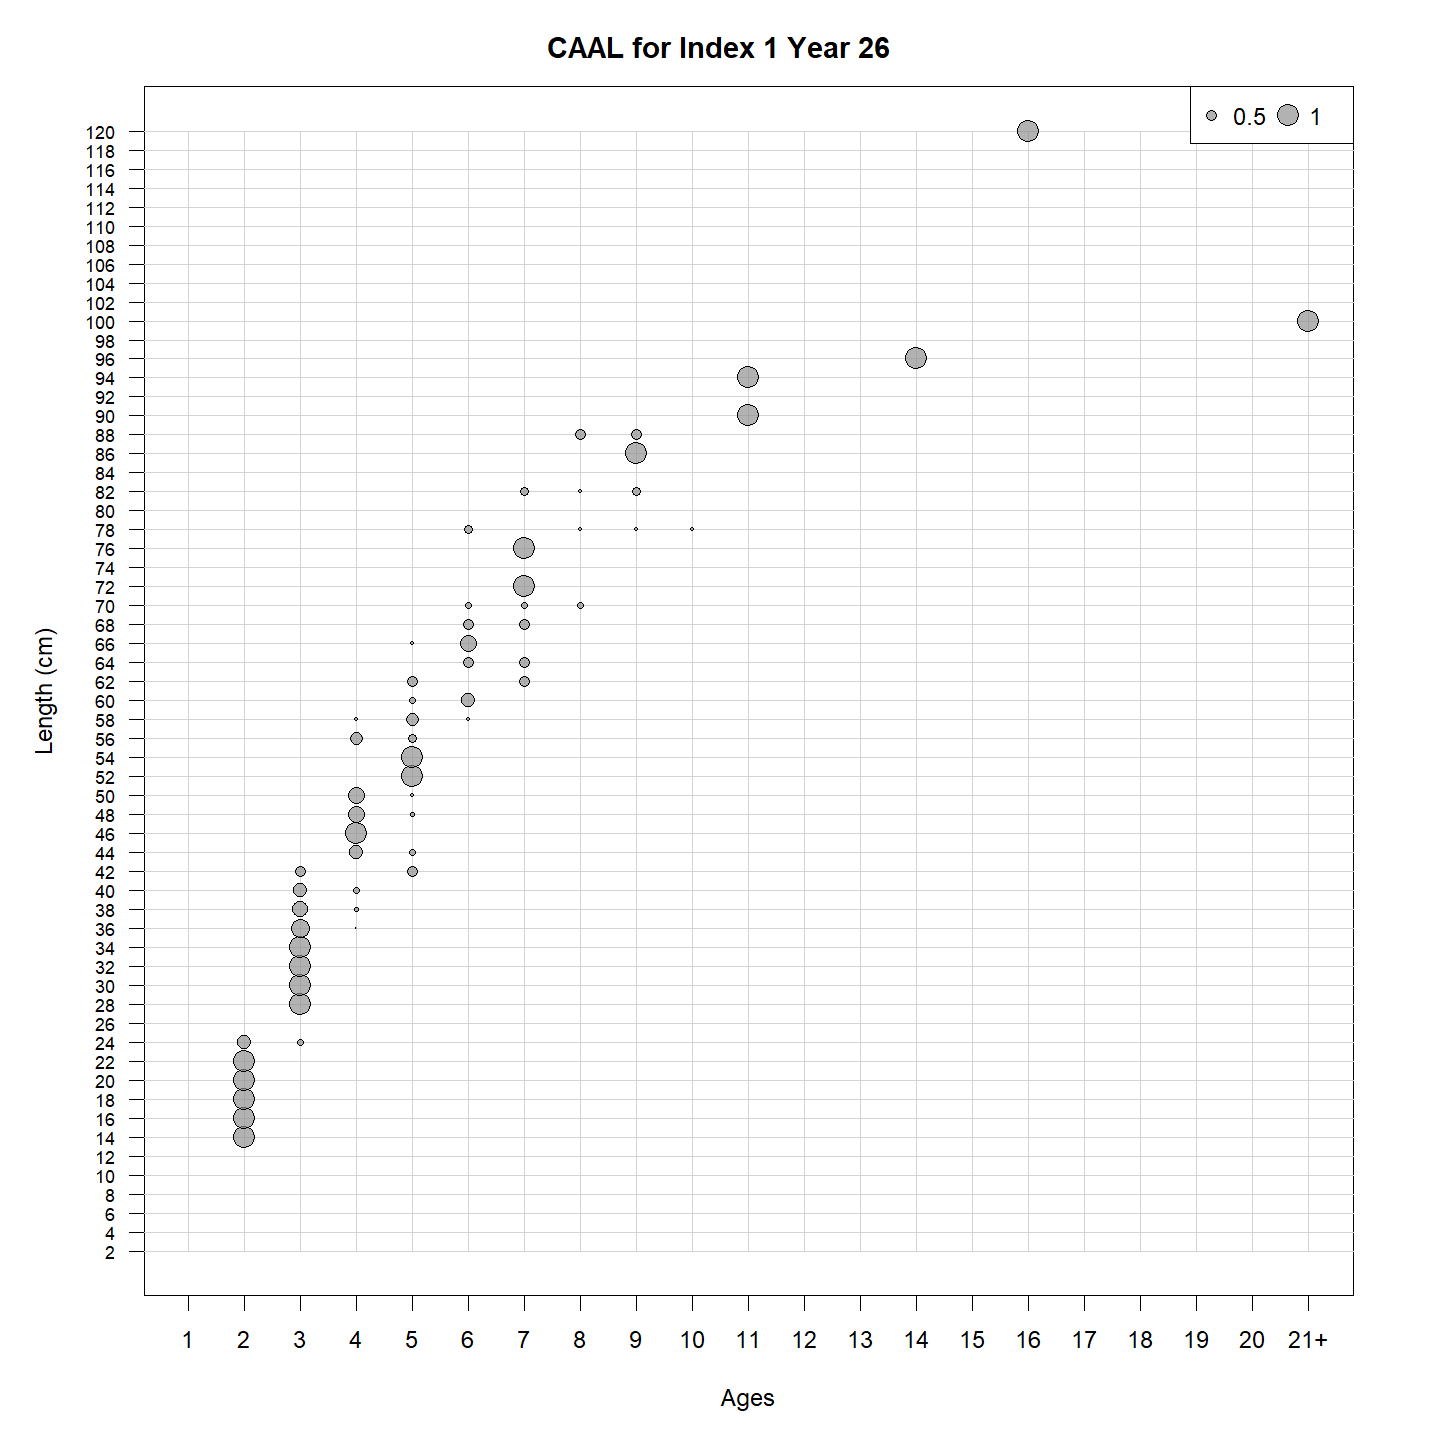
Or the input CAAL:
Diagnostics
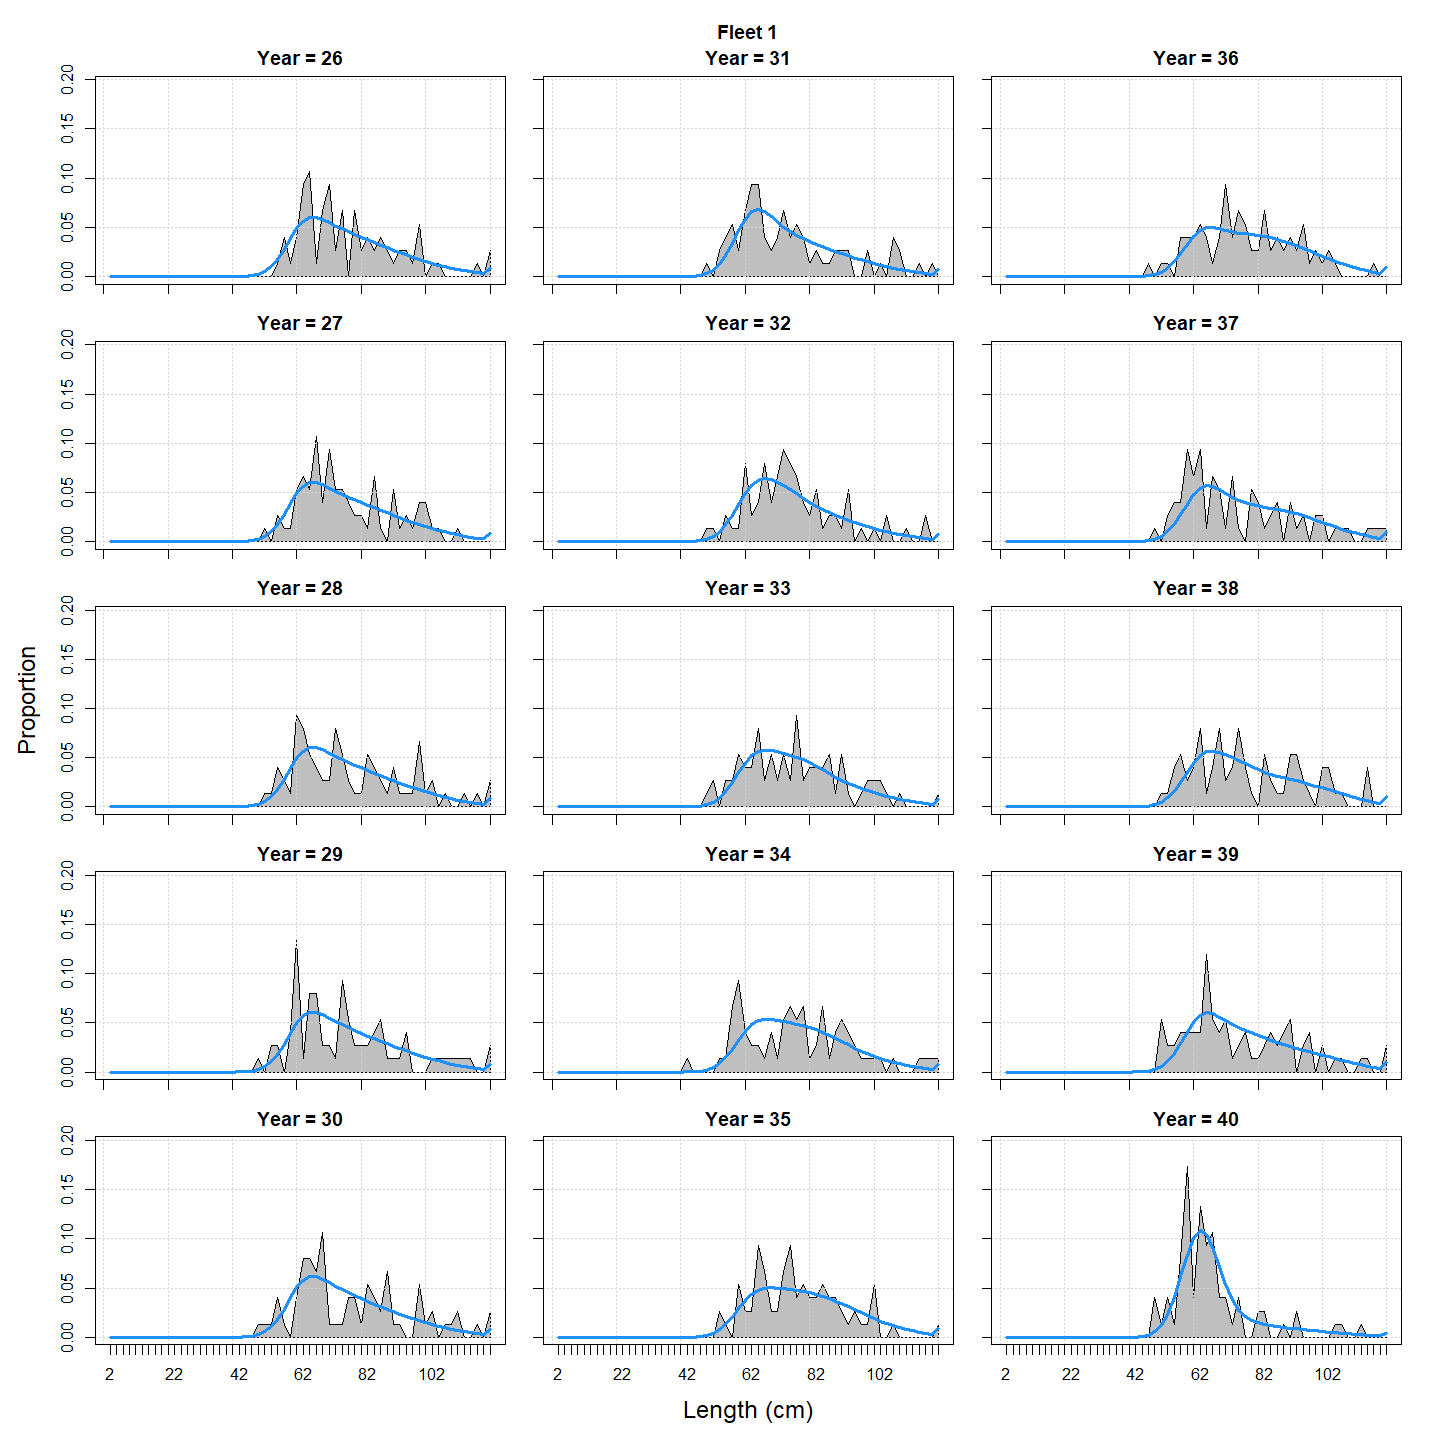
We can compare the observed vs predicted length compositions:
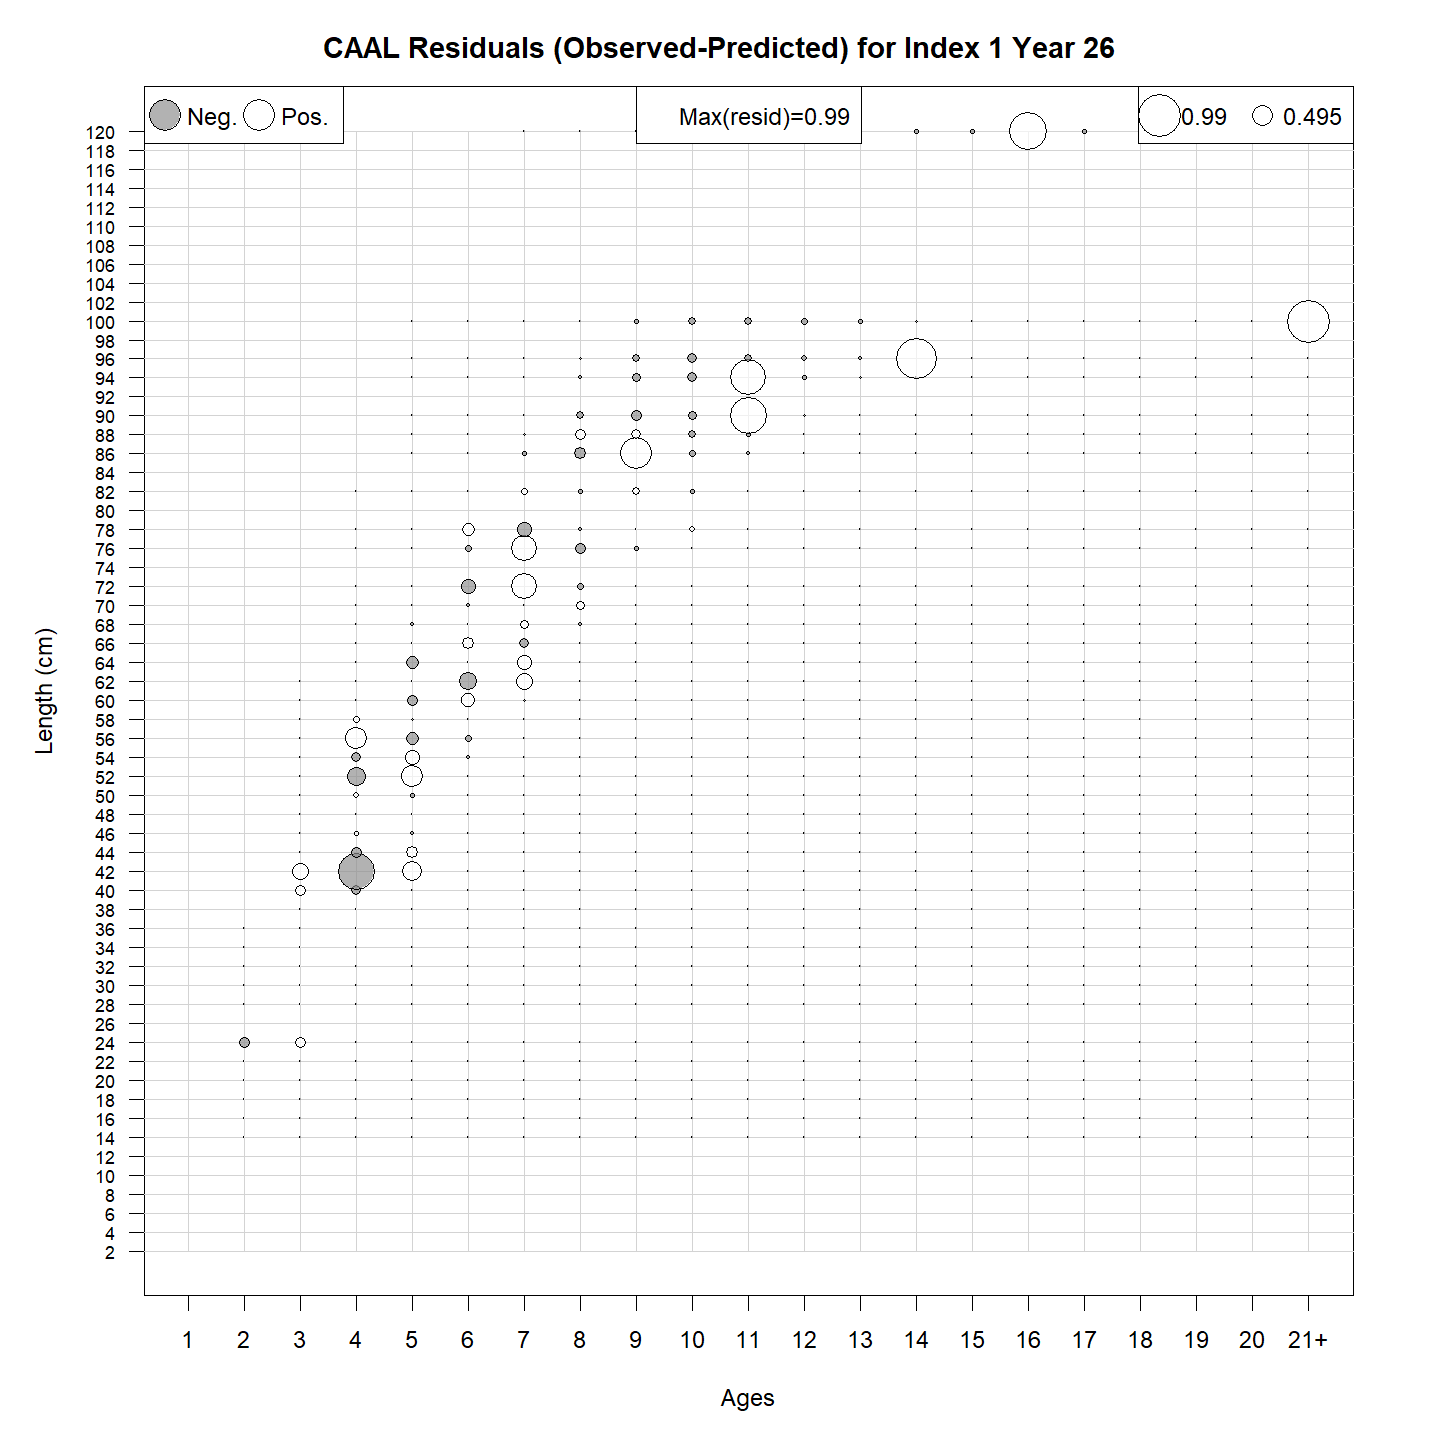
or bubble plots of CAAL residuals:
Parameters
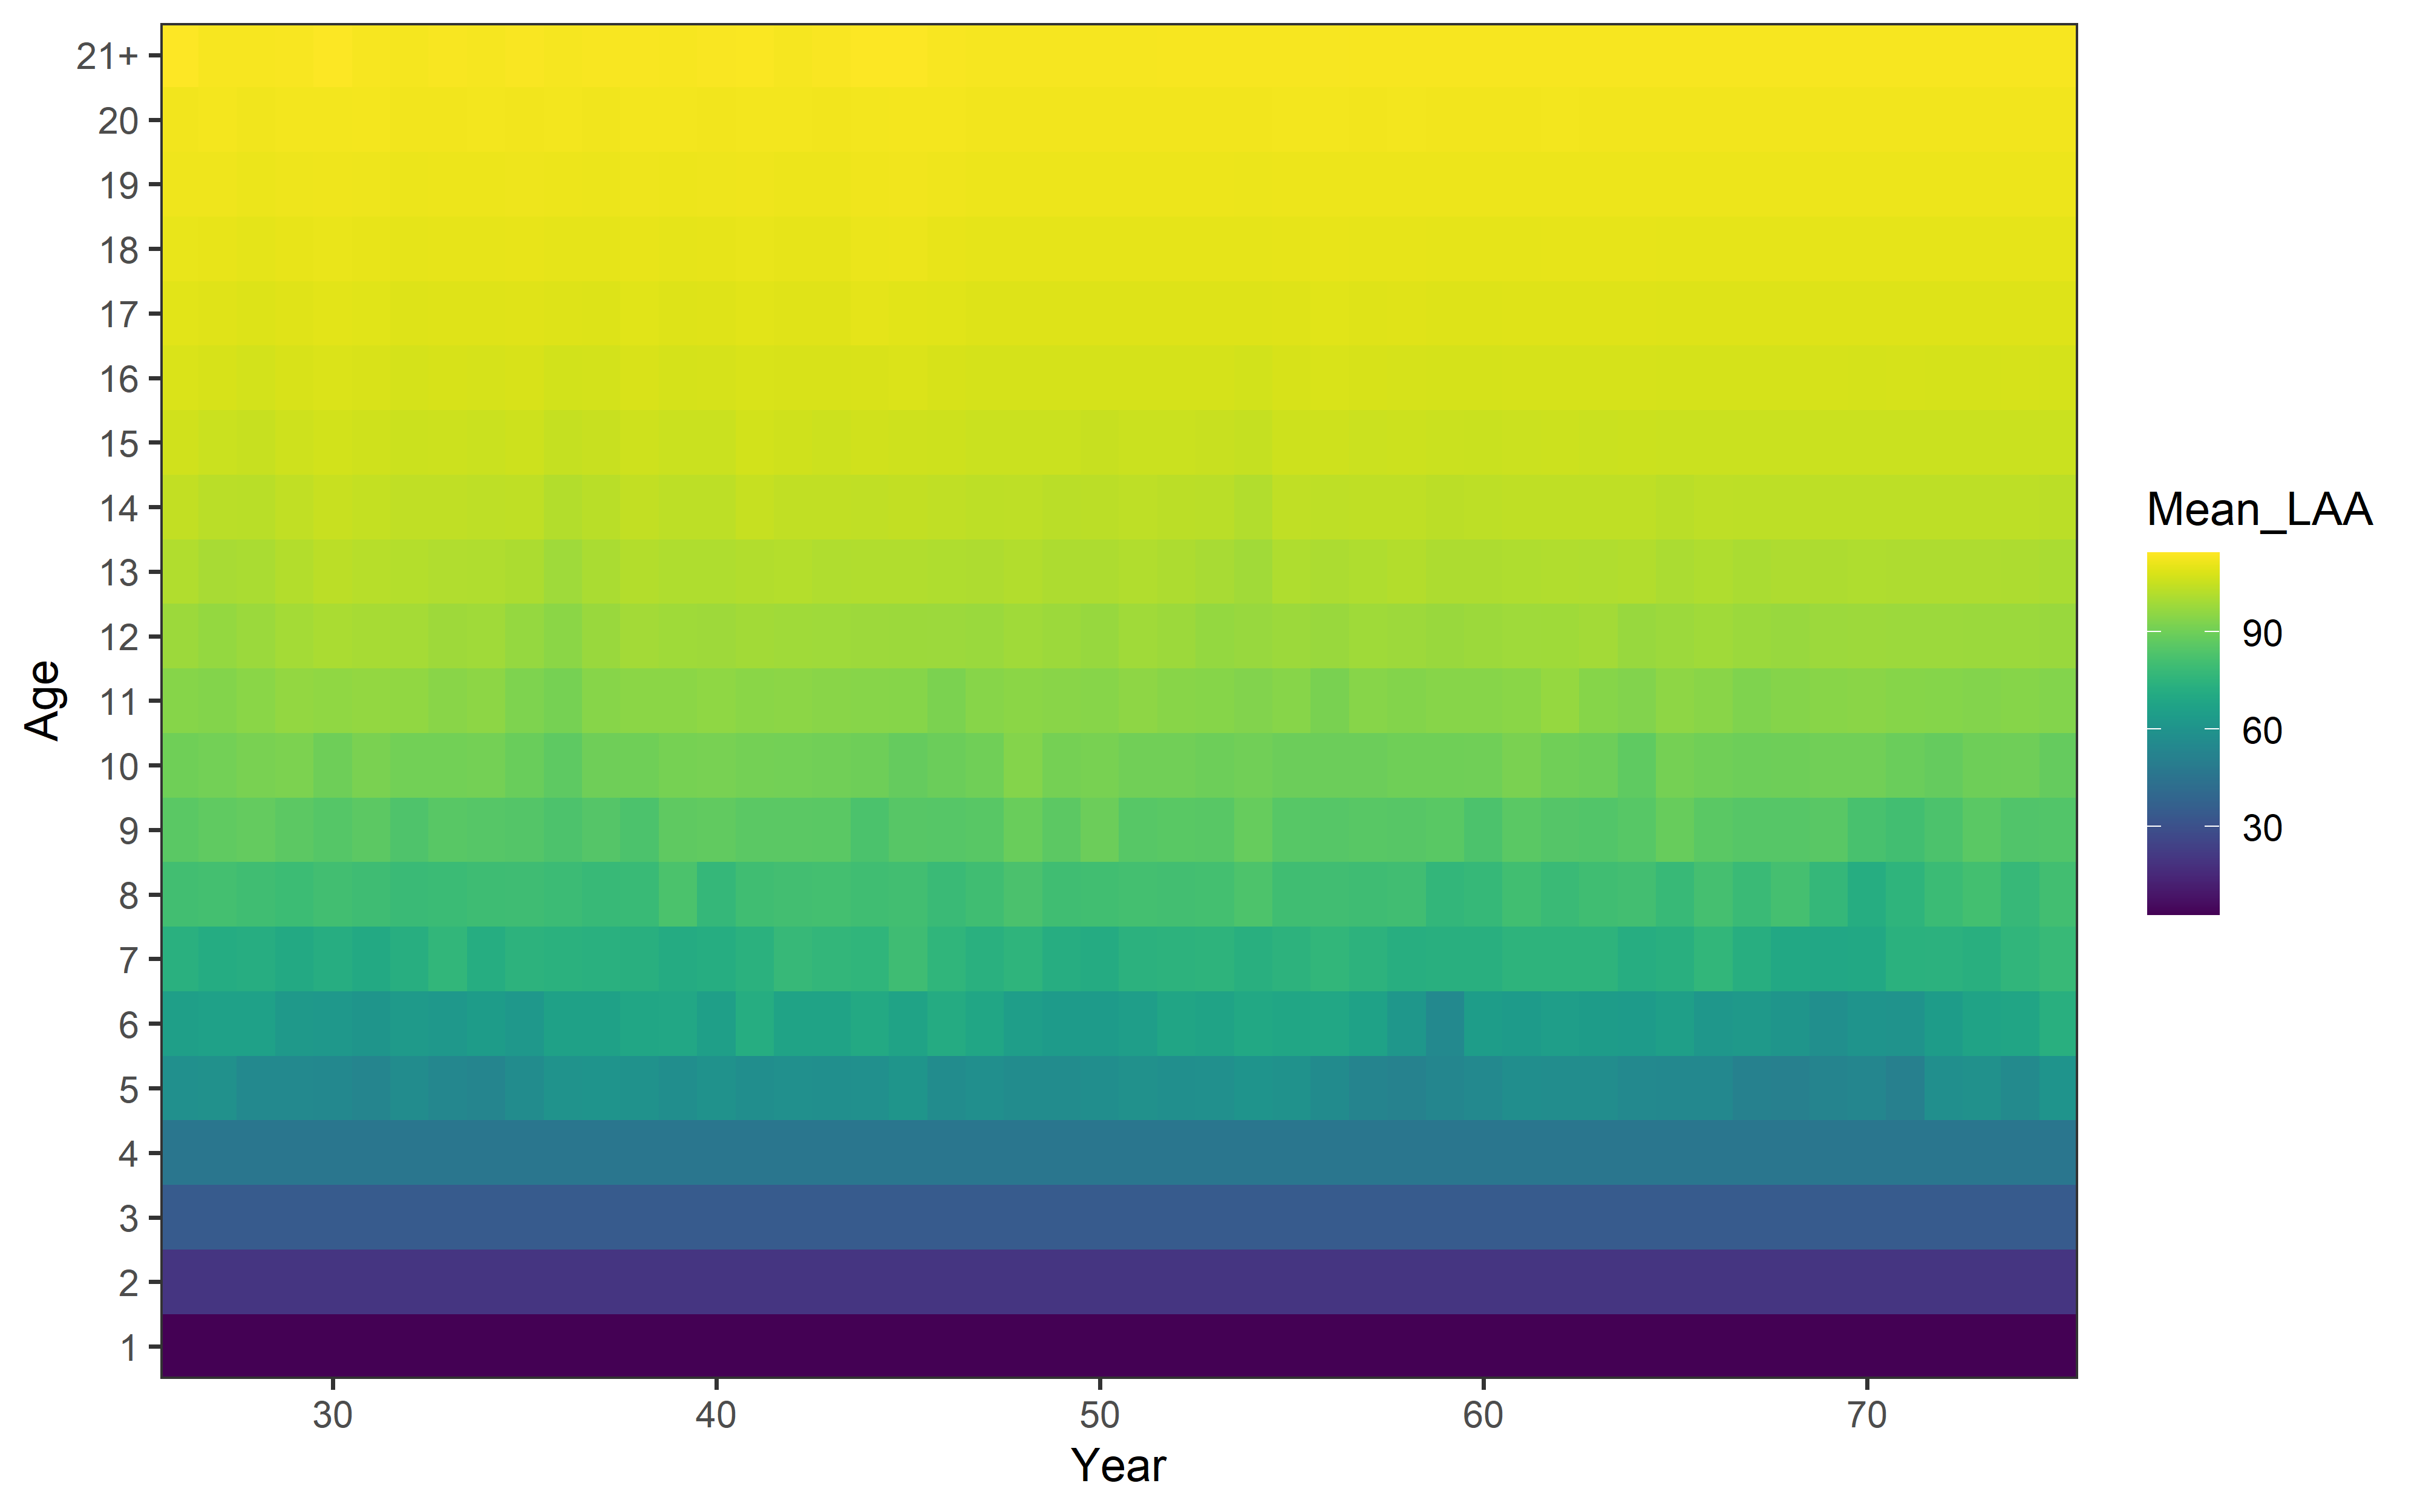
Some plots summarizing the variability in some parameters and biological
aspects are also available. For example, the variability of mean
length-at-age (when growth$model = 'LAA'):
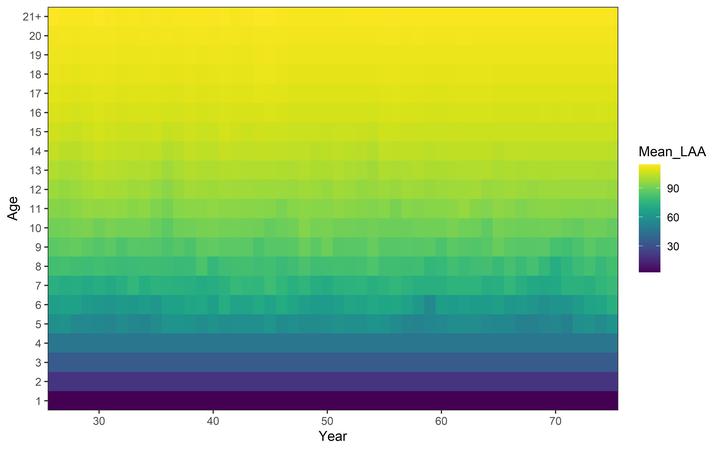
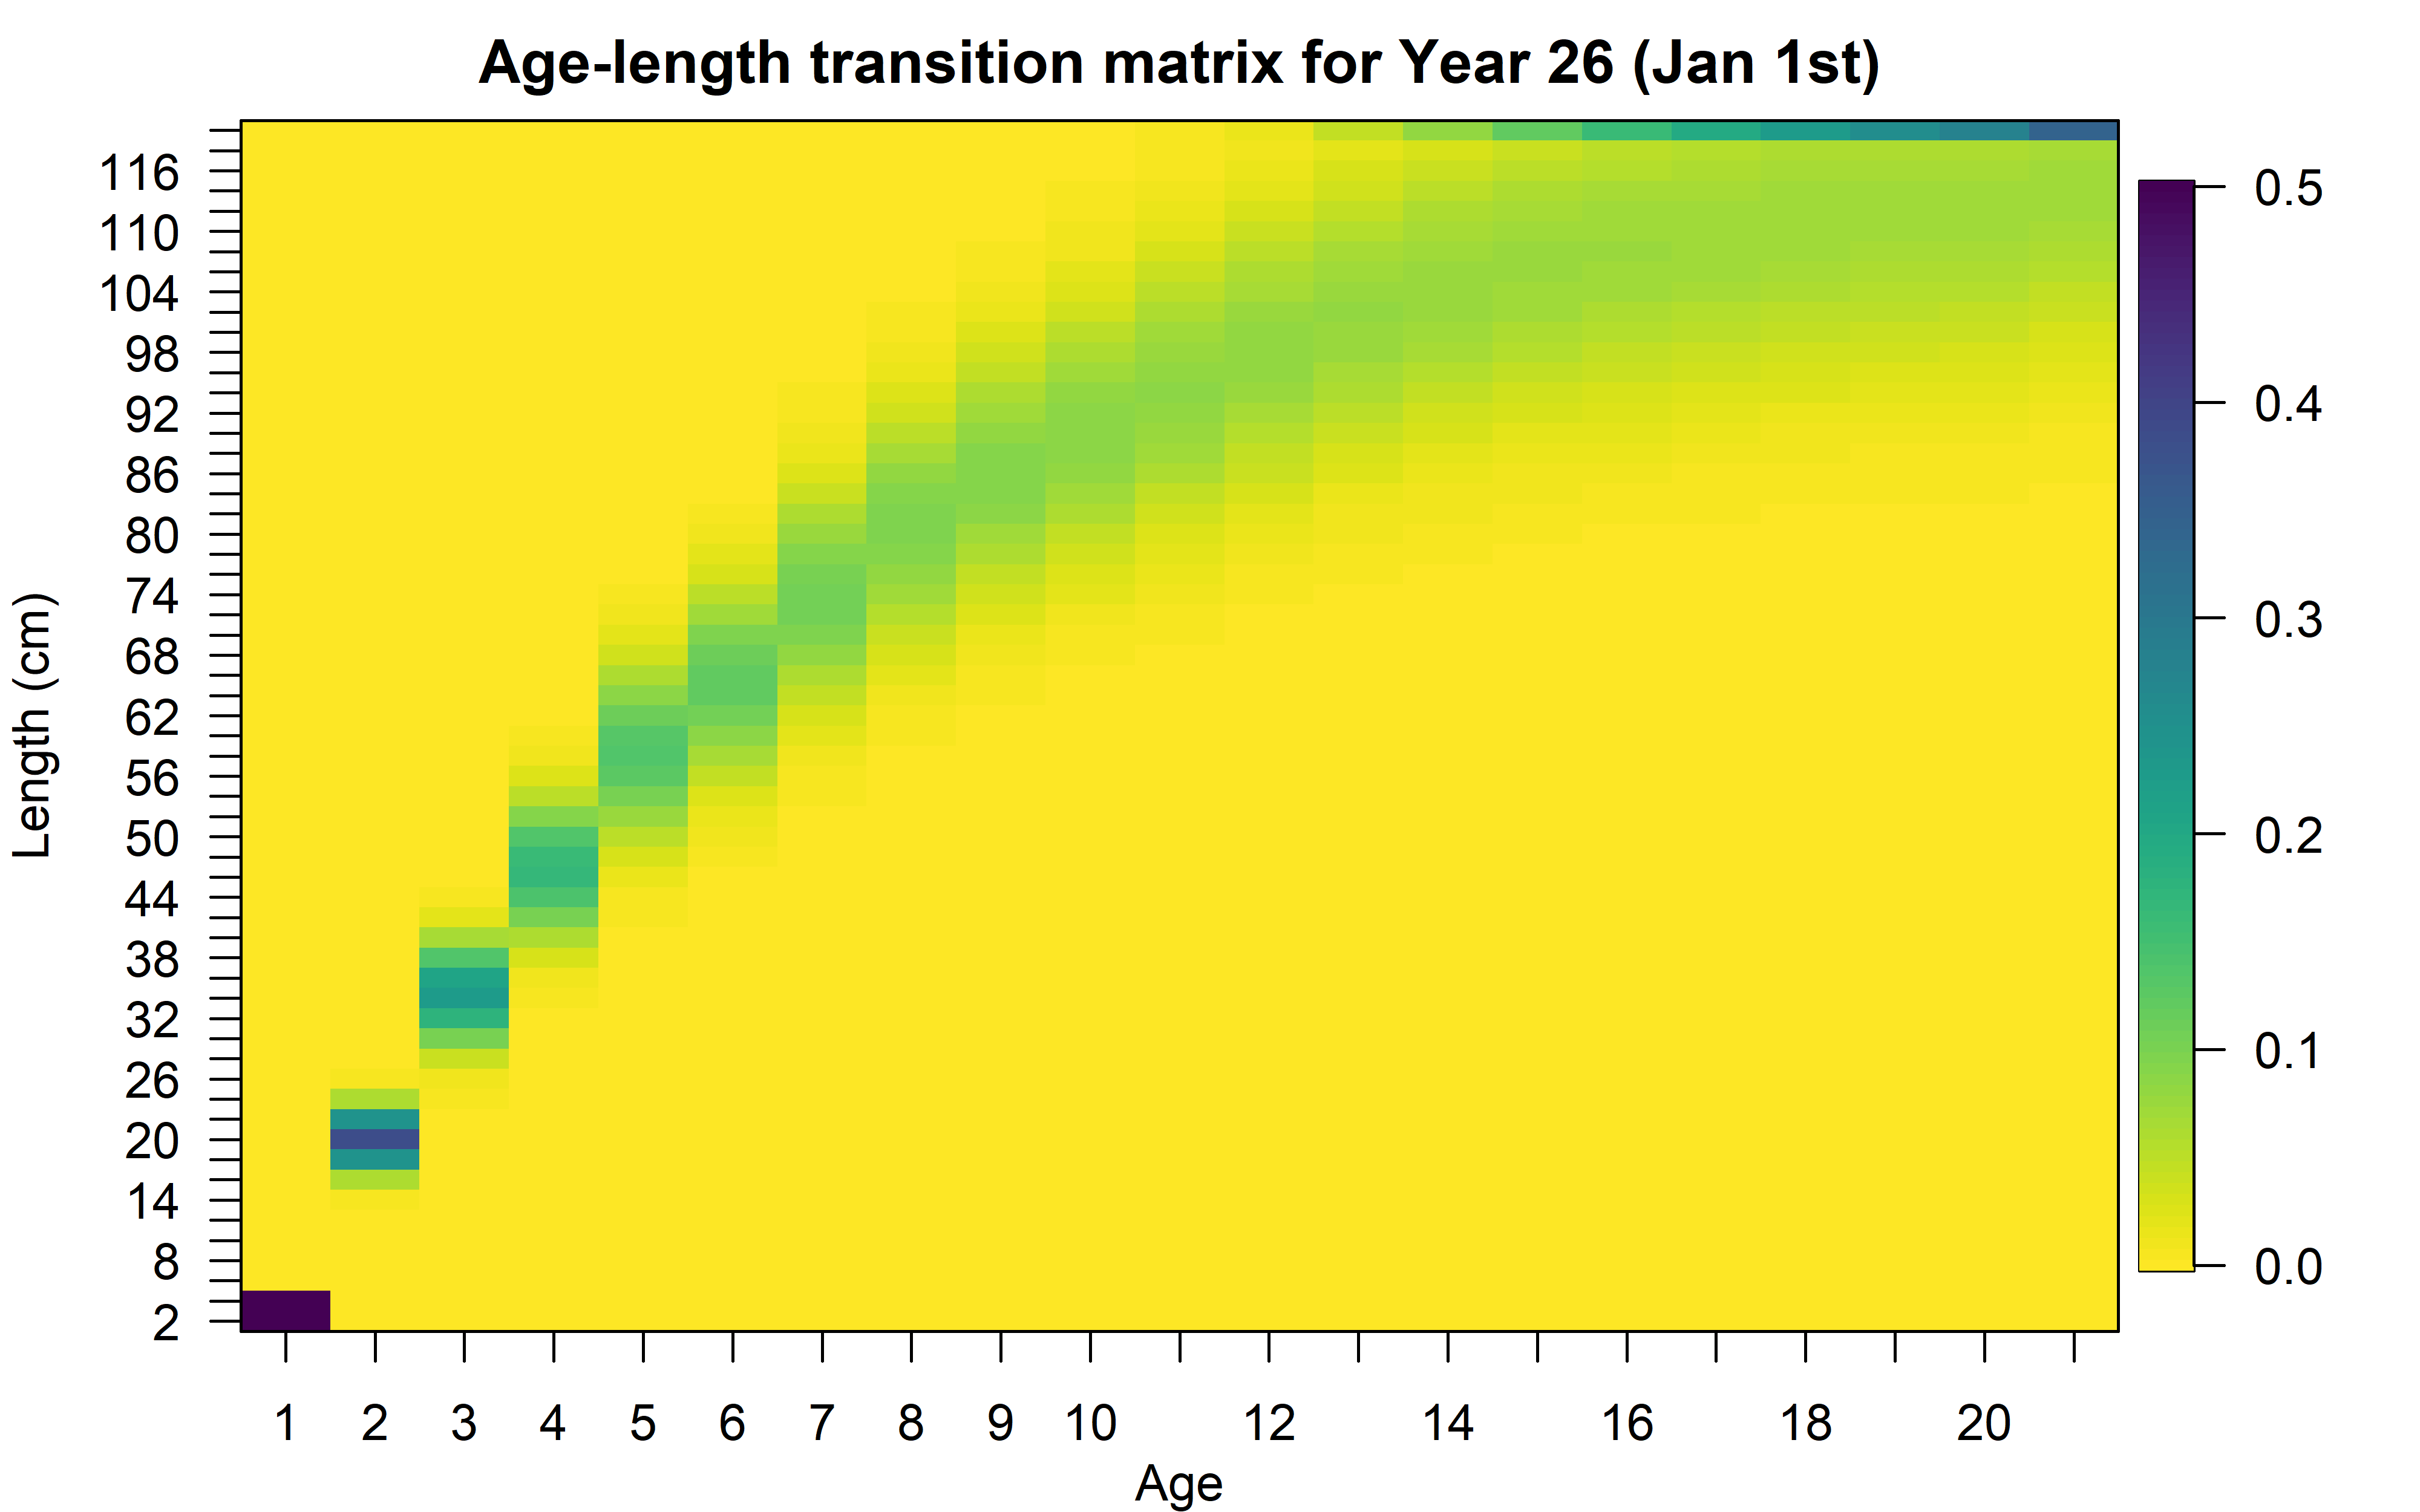
Or the variability of lengths-at-age (represented by the age-length transition matrix):
I suggest the user explores all the plots and tables produced by this function.
Examples
You can find examples about the use of the new WHAM features here.
References
Correa, GM., C. Monnahan, J. Sullivan, J. Thorson, and A. Punt. 2023. “Modelling Time-Varying Growth in State-Space Stock Assessments.” ICES Journal of Marine Sciences. https://doi.org/10.1093/icesjms/fsad133.
Privitera-Johnson, Kristin M., Richard D. Methot, and André E. Punt. 2022. “Towards Best Practice for Specifying Selectivity in Age-Structured Integrated Stock Assessments.” Fisheries Research 249: 106247. https://doi.org/10.1016/j.fishres.2022.106247.
Schnute, Jon. 1981. “A Versatile Growth Model with Statistically Stable Parameters.” Canadian Journal of Fisheries and Aquatic Sciences 38 (9): 1128–40. https://doi.org/10.1139/f81-153.
Stock, Brian C., and Timothy J. Miller. 2021. “The Woods Hole Assessment Model (WHAM): A General State-Space Assessment Framework That Incorporates Time- and Age-Varying Processes via Random Effects and Links to Environmental Covariates.” Fisheries Research 240 (August): 105967. https://doi.org/10.1016/j.fishres.2021.105967.